Plot histograms in the terminal with arbitrary streaming or non-streaming data.
$ histo < data.txt
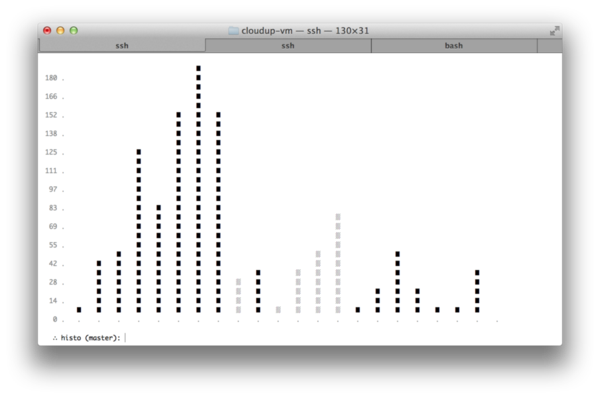
- simple input via stdin
- simple C API for integration in your tools
- supports static or streaming data
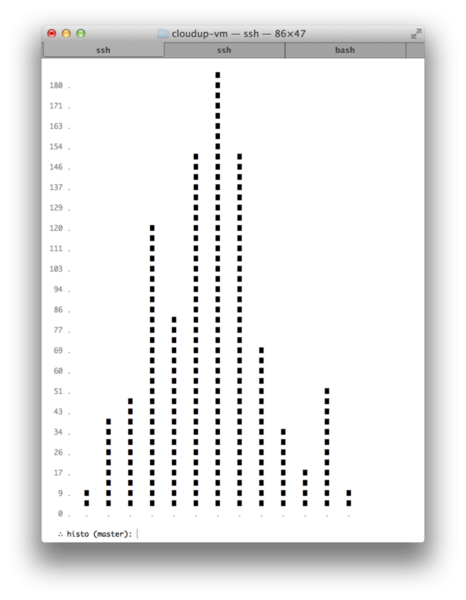
- adjusts to terminal width and height
- adjusts x-axis labels to the integer size
- negative values reflect as shaded blocks
- cpu usage
- memory usage
- load averages
- ...
With cpm:
$ cpm install visionmedia/histo
Or via git clone:
$ cd /tmp && git clone git://github.com/visionmedia/histo.git --depth 1 && cd histo && make install
histo(1) simply reads from stdin, so it works well with
streaming or non-streaming data, from any data source. This
repo includes some example files in ./examples, as well
as some example shell scripts for streaming input.
hist(1) simply reads from stdin, so it's easy to throw static
data at it for quick analysis:
1
4
5
12
8
15
18
20
5
2
1
5
2
10
2
Displayed with:
$ histo < example.txt
You may stream data to histo(1) and tell it to quit with EOF,
for example here's a small shell script to generate some random
data:
while true; do
  echo $RANDOM
  sleep .5
done
Display with:
$ sh example.sh | histo
Negative values are shown as shaded blocks:
Adjusts properly to the size of the terminal:

MIT